Power BI
This is a detailed analysis of a survey of 630 data professionals,
I used Power BI, with Power Query to transform and clean the data and then build an interactive dashboard.
This breakdown explores the most used programming languages, happiness with salary, and work-life balance, and it shows worldwide information or you can also segment between different countries and gender.
Check out this report, where you can download the dashboard to use it with the Power BI desktop app.


This football data analysis project aimed to identify the best young strikers by considering various primary and secondary criteria.
By utilizing a scatter plot visualization, the analysis provided decision-makers with a comprehensive overview of players' skills, facilitating informed recruitment decisions.
Checkout the analysis and the interactive visualization, you can play with the filters!

No matter what tool we're using, we almost always need to clean our data with SQL in a data project.
Starting from a raw dataset, I developed multiple SQL queries in order to clean and model the data and leave it prepared for any kind of further analysis.
You can see the main dataset and the queries below.

This analysis was intended for people who want to list their properties for rent on Airbnb in Seattle.
It can be used to answer questions like which locations produce the most revenue, when does the demand increase, revenue for each bedroom number, and competition for each type of apartment.
It was made in Tableau and it can be used online in Tableau Public, check out the insights and the interactive dashboard!

Knowing how to create complex queries in SQL is a must.
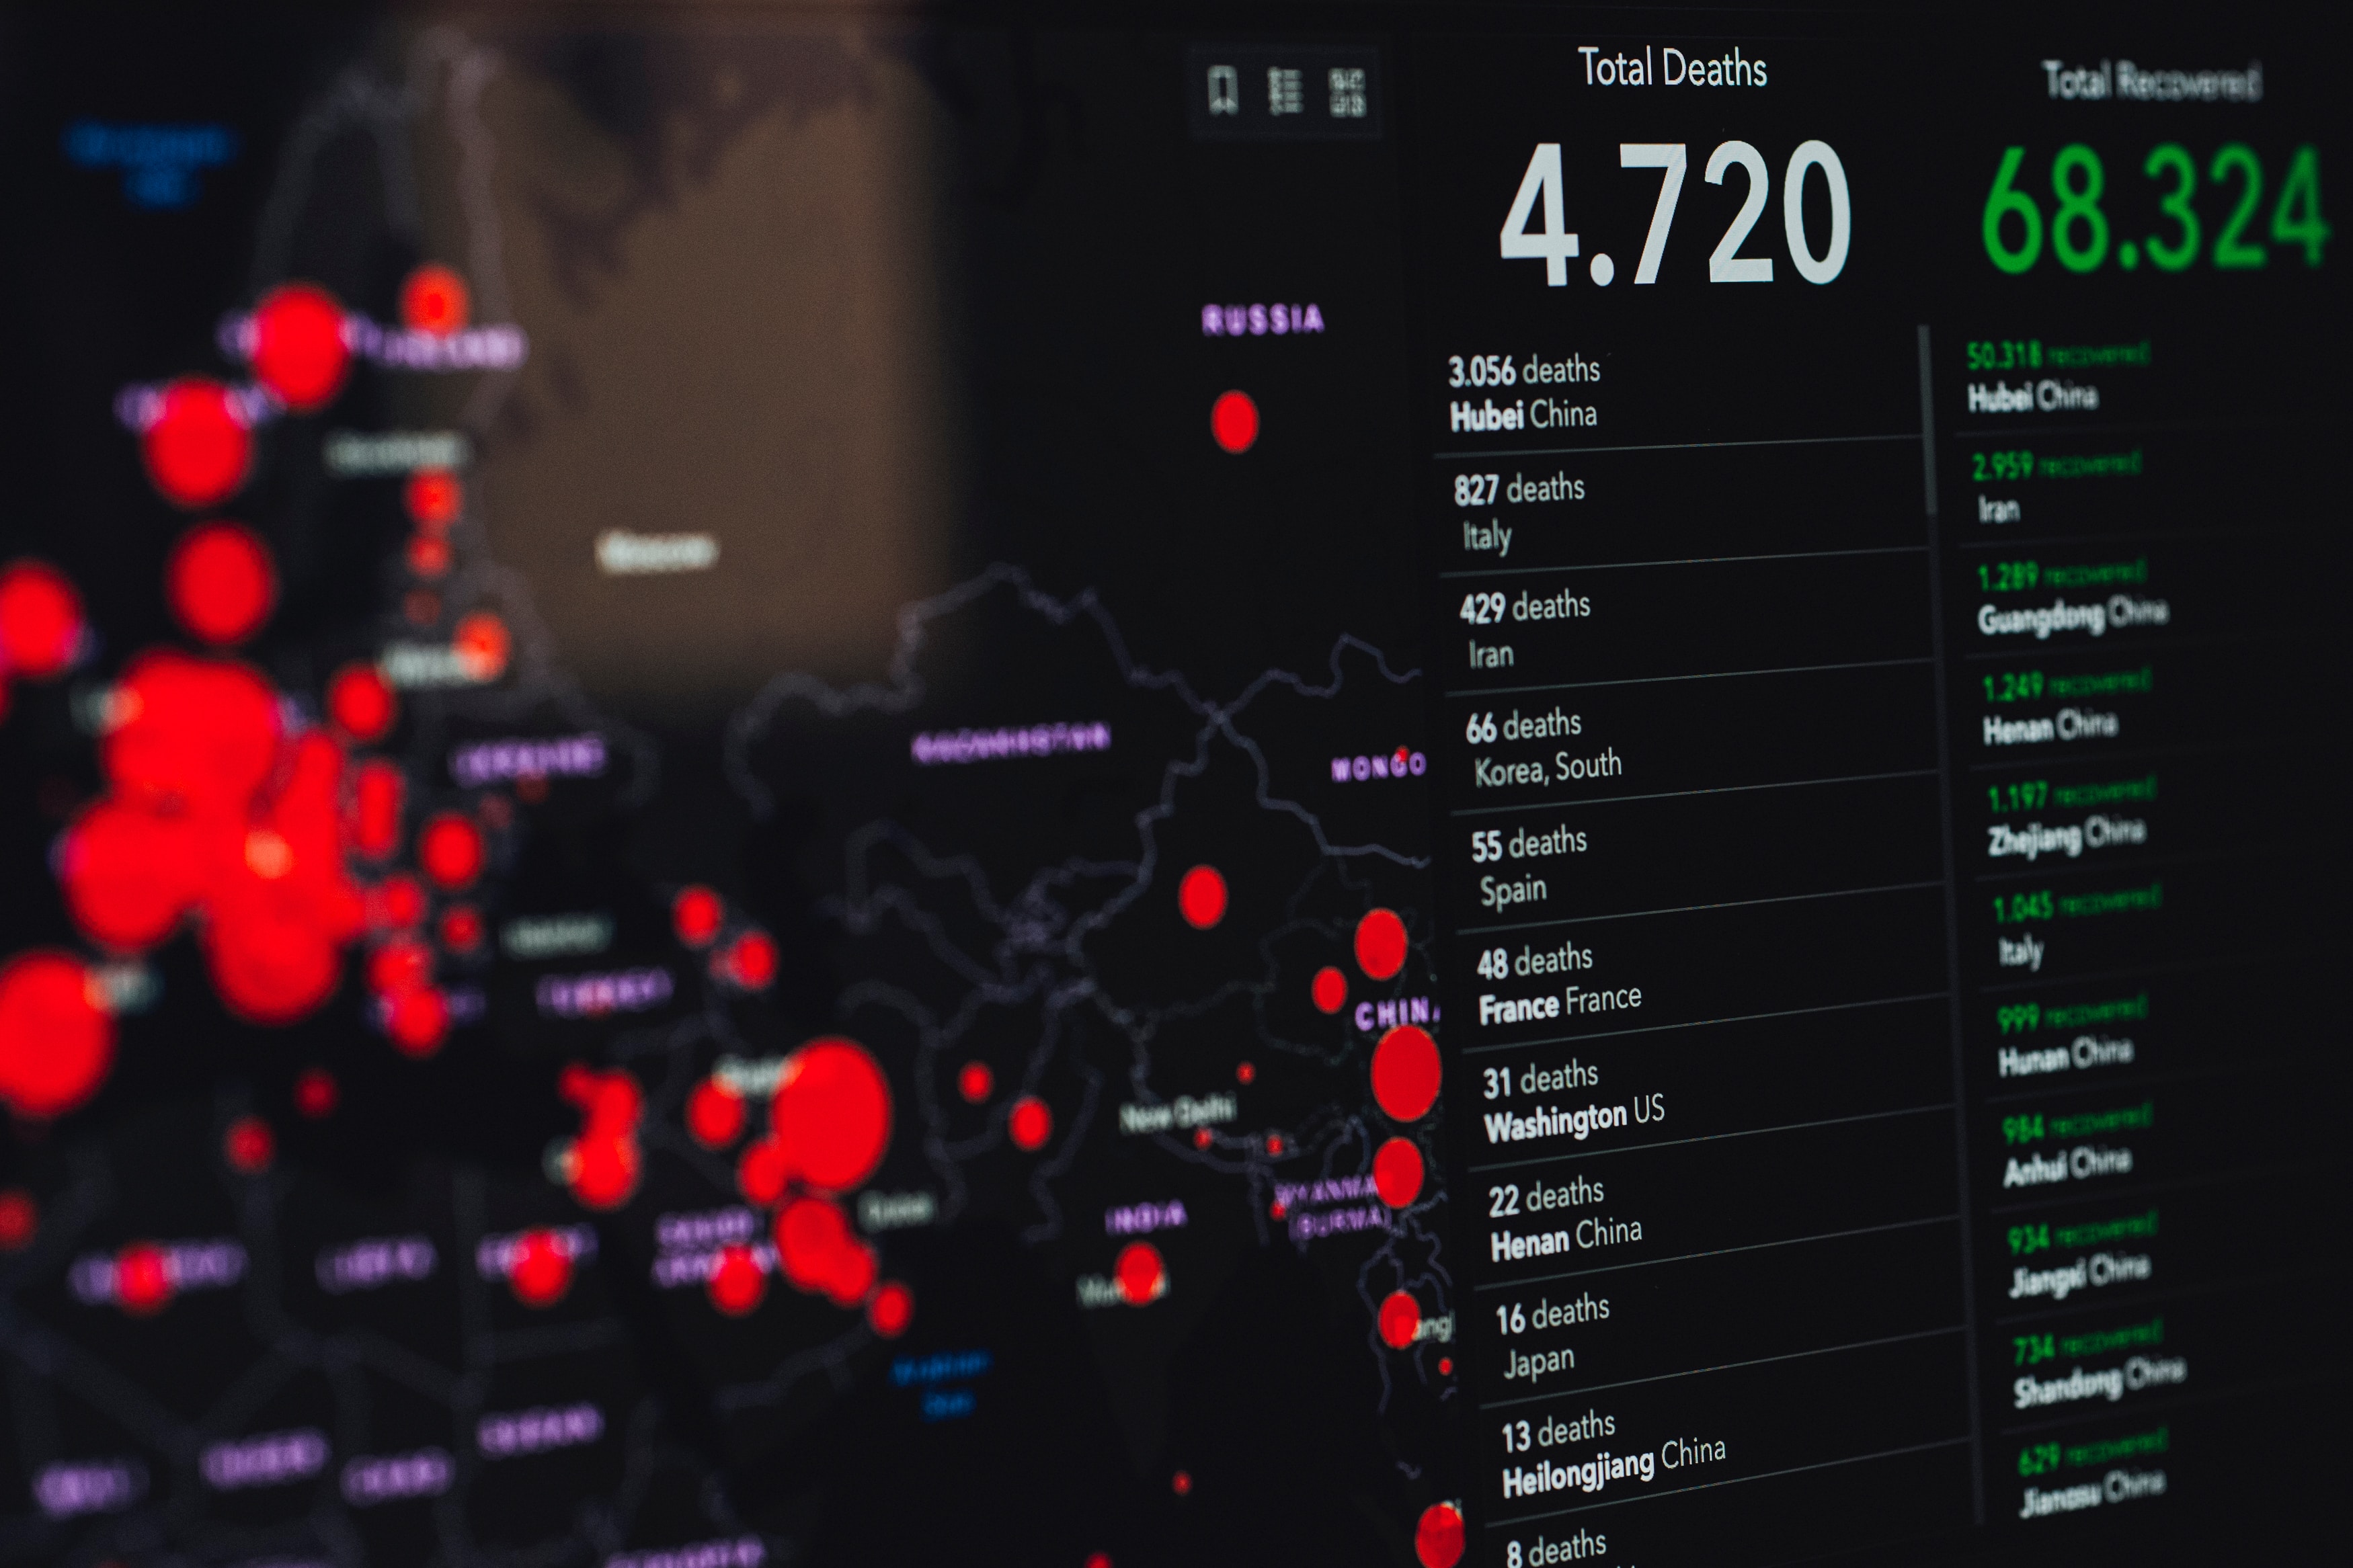
Here I explored a COVID-19 dataset with different complex SQL queries to answer questions about the data.
Skills used: Joins, CTEs, Temp Tables, Windows Functions, Aggregate Functions, Creating Views, Converting Data Types.
Check out the data and the queries below.

Excel is never fashionless.
Starting from a buyers dataset of a bike store, I cleaned the data, made the necessary pivot tables, created interactive filters, and made a simple dashboard of three useful visualizations that answer common questions that the owners can have.
Give it a view!


